Background
Freight Railroad is the most effective way to transport large quantities of material across land.
- One train carries as much freight as hundreds of trucks. If the goods that railroads move were to instead move over highways, those highways would be choked with additional traffic.
- Freight railroads are 3-4x as fuel-efficient as trucks.
- Moving freight by train results in a reduction of around 75% in greenhouse gas emissions.
- Railroads account for around 40% of long-distance freight volume but only 1.9% of transport-related greenhouse gas emissions.
Freight Railroad offers benefits to municipal economic development. Kyle Kearns, Director of Community Development for the City of Wisconsin Rapids points out that the WEDC regularly queries communities regarding assets like rail access. Rail access is a key driver for some manufacturers and suppliers. Future opportunities for economic growth are available in Rapids East Commerce Center. Companies like Metalco have taken advantage of access to rail and land to grow their business in this area of the city. Ninety-Eight percent of the Wisconsin Rapids Community agrees with the importance of rail and truck traffic to the region.
Increasing freight rail traffic has plagued communities for decades with increased congestion, delays, noise and safety consequences. Wisconsin Rapids experiences 1500’ backups multiple times a day, frequent complaints about noise and a plethora of rail congestion related issues. There is a history of searching for solutions including a rail relocation initiative back in 2000. We are performing a Comparative Study for improving sustainability, reducing congestion, reducing noise and improving safety while minimizing costs and implementation hurdles of improvements. The study will focus on the grade crossings at Gaynor Ave, 17th Ave S, Chase St, W Grand Ave, High St and Fremont St. while also considering impacts on other relevant crossings and/or potential relocation areas. The purpose of the study will be to find the optimal solution for reducing rail congestion and noise within the City of Wisconsin Rapids. This includes:
- Evaluating rail movements and operations within the study area.
- Identifying opportunities to decrease congestion, safety issues and noise due to rail traffic.
- Analyzing potential alternatives and improvements.
- Determining the physical and financial viability of such potential improvements.
Executive Summary
This is a summary of the Wisconsin Rapids Rail Study completed December 2022
Completed:
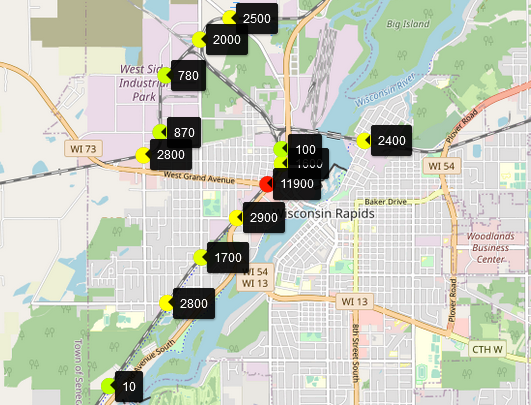
- FRA crossings database and WisDOT traffic count information was collected for 13 at-grade crossings in Wisconsin Rapids as visualized in Figure 1 above.
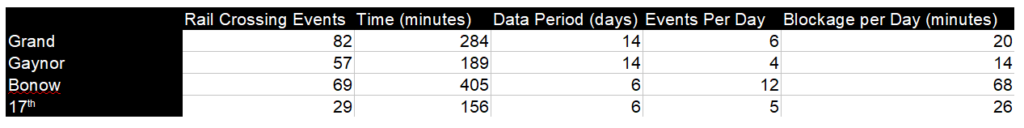
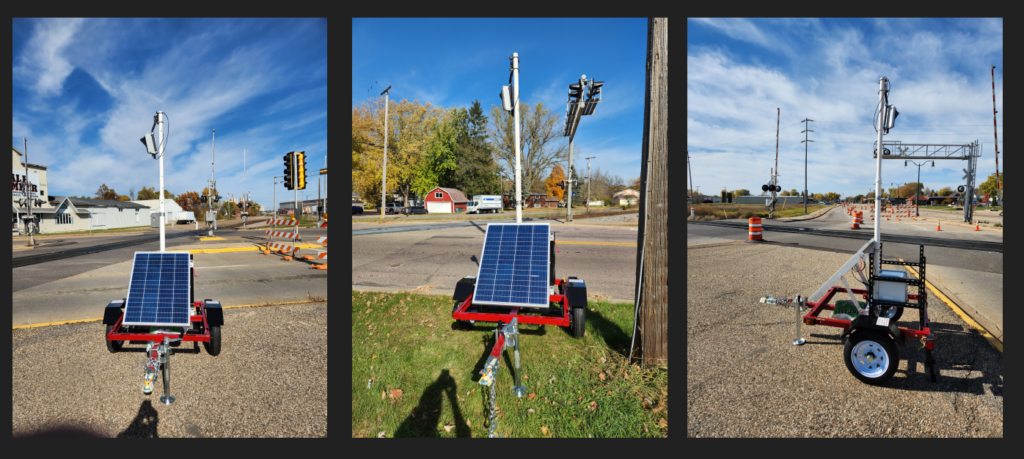
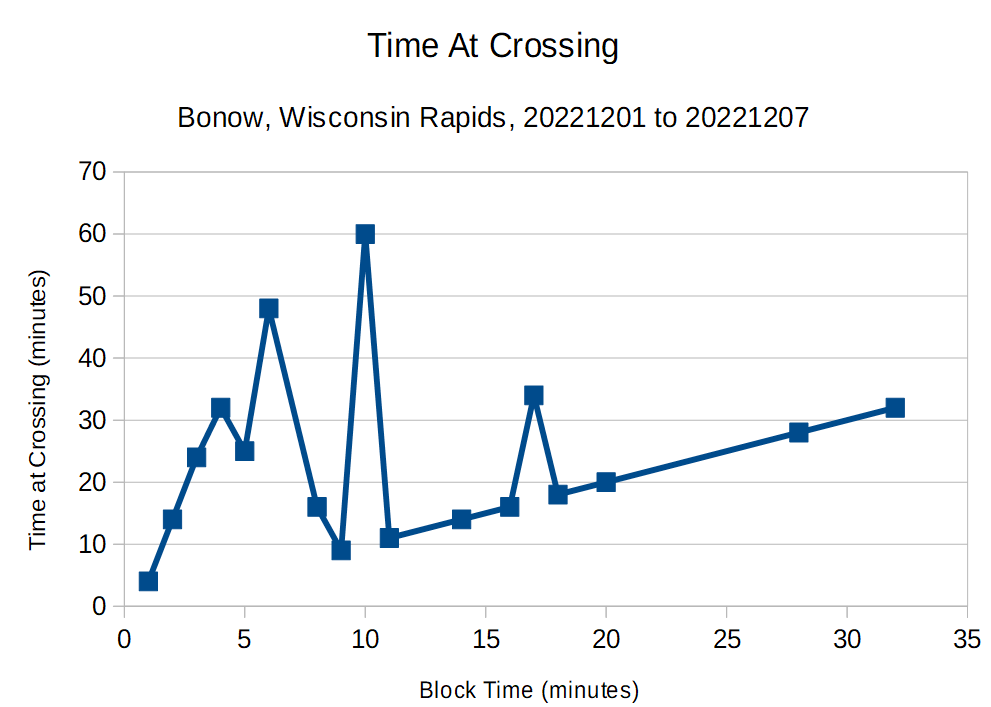
- Sensor Data using LinqThingz’s trailer mounted Predictive Mobility Sensors was collected at W Grand Ave, Gaynor Ave., 17th St and Bonow Rd. Sample data appears below.
- A community Survey was deployed and collected 955 responses regarding public opinion concerning rail traffic in Wisconsin Rapids. Sample data appears below.
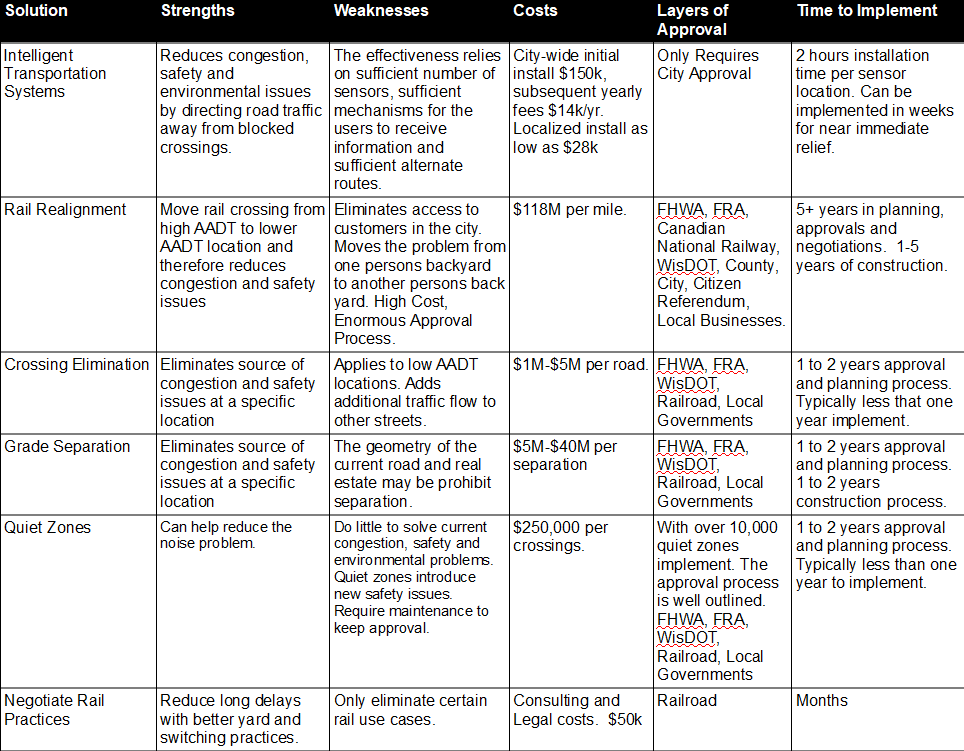
- Information has been collected from other rail projects and an initial SWOT analysis with pricing estimates has been created. Initial SWOT decision matrix appears below.
- Initial Community Congestion Impact Calculations appear below.
- Preliminary recommendations (prior to merging consensus with Patrick and completing interviews with stakeholders)
- Collected traffic sensor detail at other locations and looking at specific metrics.
- Completed additional surveys of businesses and stakeholders.
- Completed additional details regarding decision matrix and recommendations.
- Detailed Intelligent Traffic Systems (ITS) implementation analysis.
- Safety analysis.
- Noise analysis with LinqThingz data.
- Quality of life assessment.
- Integration with Patrick Engineering efforts.
High Level Results
Rail congestion is a concern for 95% of the survey respondents followed by safety, noise and pollution. Crossings are the highest concern to the community followed by safety, then noise and pollution.
95% of the community respondents have been blocked by rail traffic in the past 30 days.
Almost 60% of the community respondents have experienced blockages over 20 minutes in the past 30 days.
Almost 75% of the community have waited at a crossing between 5 and 20 minutes.
85% of the community have missed important appointments due to blocked crossings.
Almost 95% of the community engages in dangerous or risky behavior to avoid blocked crossings.
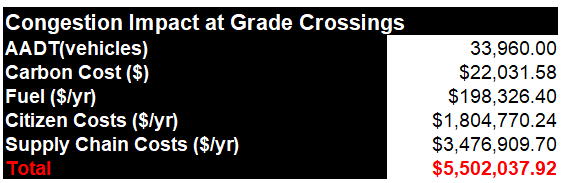
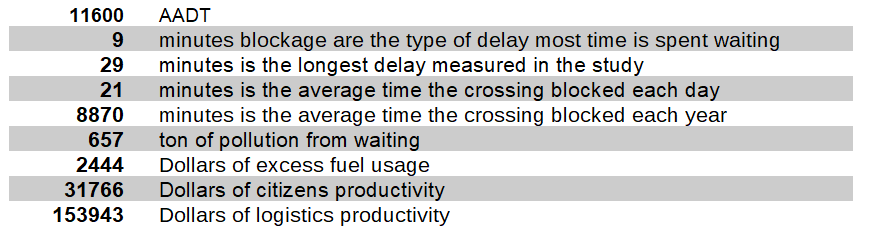
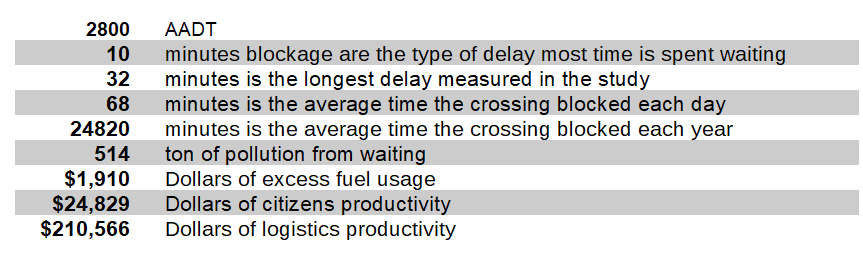
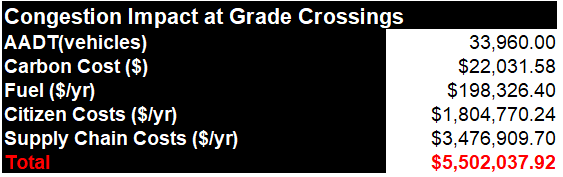
The preliminary, calculated, congestion impact of rail is summarized in figure 2 below. The Average Annual Daily Traffic (AADT) number is only for the roads with grade crossings considered in this study.
Project Details
Investigate, review and inventory at-grade railroad crossings, road characteristics, etc.
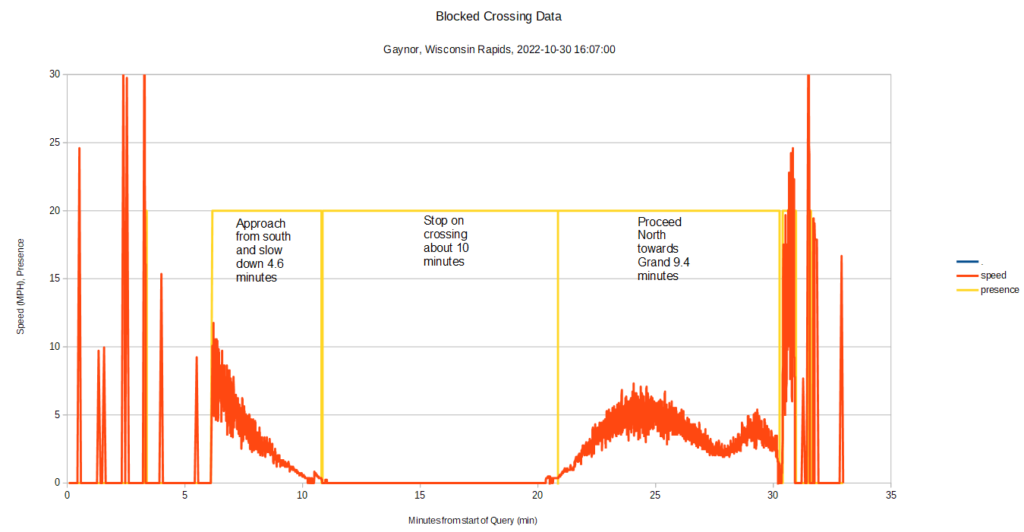
LinqThingz has installed temporary mobile sensors on municipal property along the rail line to measure rail traffic. These sensors collect data from blocked crossing at 0.1 second intervals along with measurements of speed, direction and length of train traffic. This is being performed using LinqThingz’s TrainLinq product. The sensors have been installed at W Grand Ave, Gaynor Ave., 17th St and Bonow Rd. The data includes calculated count of blocked vehicles, time of blocked vehicles, approximate noise level elevation, rail through versus rail switching delays, estimated fuel usage, estimated carbon pollution, estimated excess fuel usage, estimated resident productivity costs, estimated logistics impacts, and estimated emergency response impacts at all crossings along that stretch of rail line.
Road Traffic in Wisconsin Rapids
The major road traffic through Wisconsin Rapids via Hwy 51/54 is not affected directly by rail traffic because of the grade separation near Forest Hill Cemetery. However, there is a significant amount of east-west traffic from Hwy 54 that crosses via W Grand Avenue. The rail does have a significant effect on traffic on Hwy 13, 73, and 34 along the north-south rail in town. The data indicates about half of this traffic is passing through the city and about half has destinations inside the city.
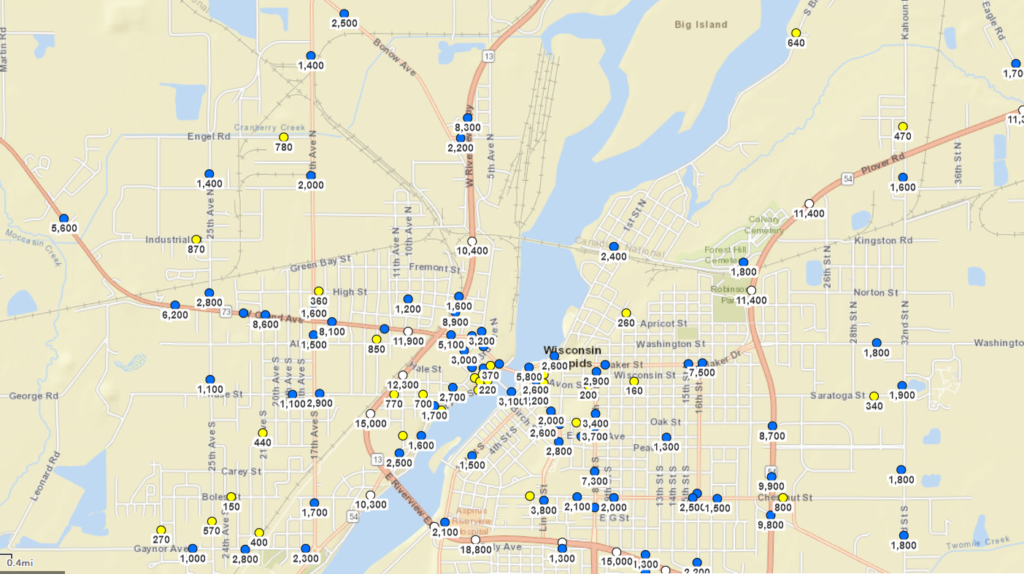
Rail Traffic In Wisconsin Rapids
There are 13 At Grade Crossings with AADT greater than 500 vehicles per day, for a daily traffic flow at grade crossings of about 35,000 AADT. Of these crossings the biggest impact is W Grand Avenue with an AADT of 11900 in the vicinity of the rail crossing. Hwy 13 passes parallel to a set of tracks and the rail crossing at W Grand Ave. has not only an impact on both traffic turning onto W Grand and traffic that gets backed up due to turning lane traffic queues. Here is a summary of rail traffic characteristics in Wisconsin Rapids
The rails in Wisconsin Rapids, owned by WSOR, are not on a major freight line (40+, 1-2 mile-long, through trains a day) and serve predominantly regional freight customers.
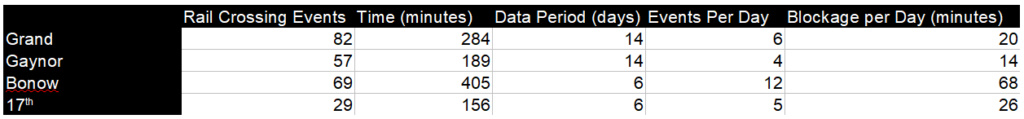
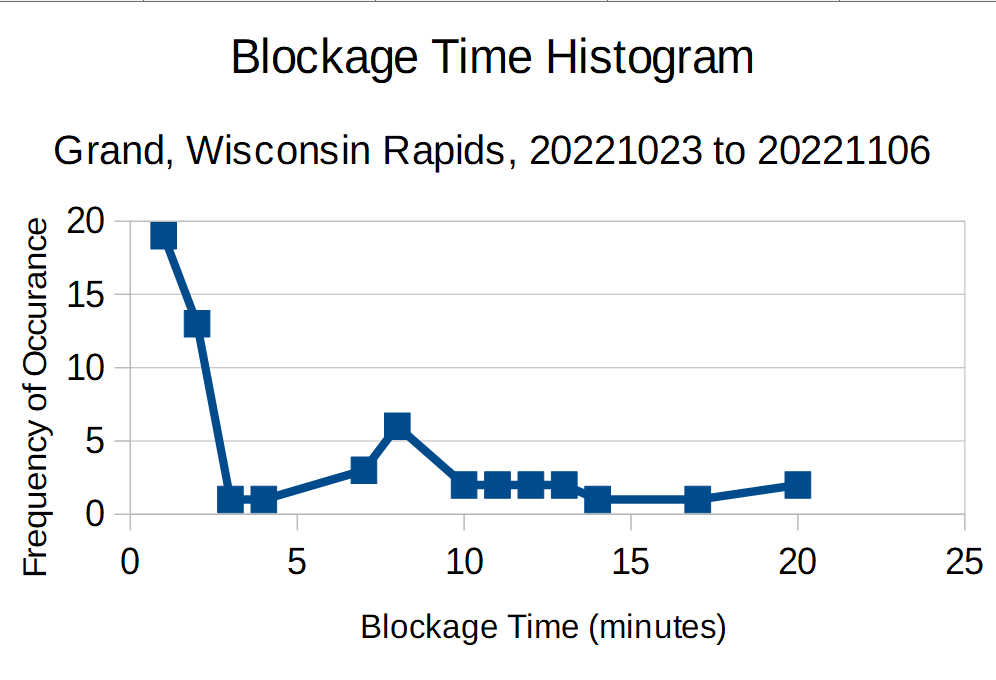
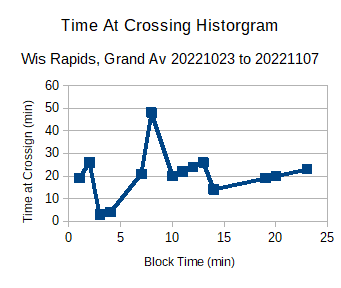
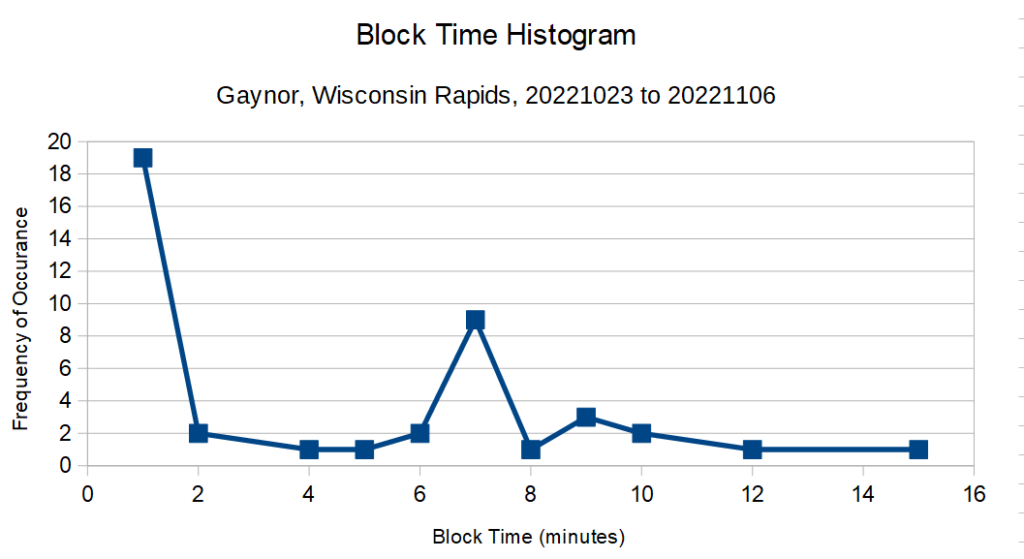
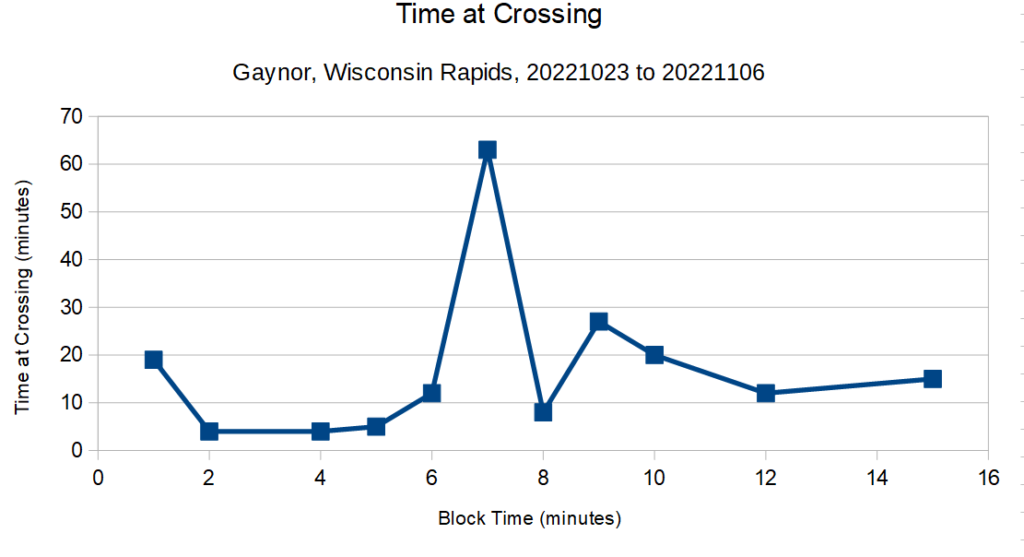
Grade crossings are blocked regularly more than 20 minutes at a time.
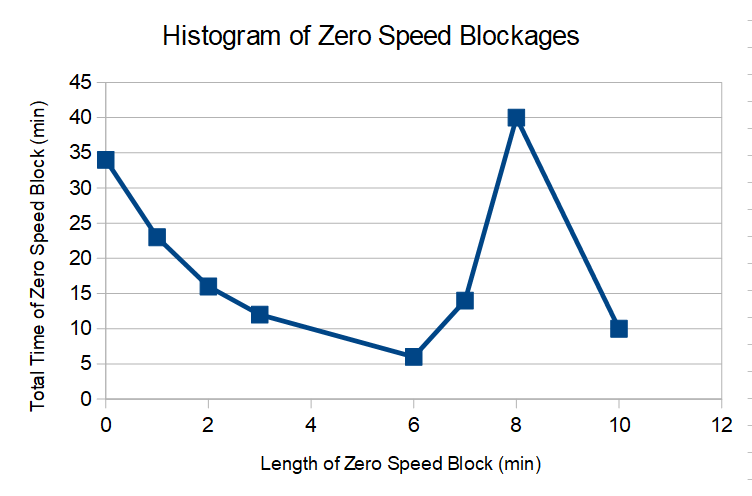
Grade crossings are blocked more than 8 minutes 50% of the time.
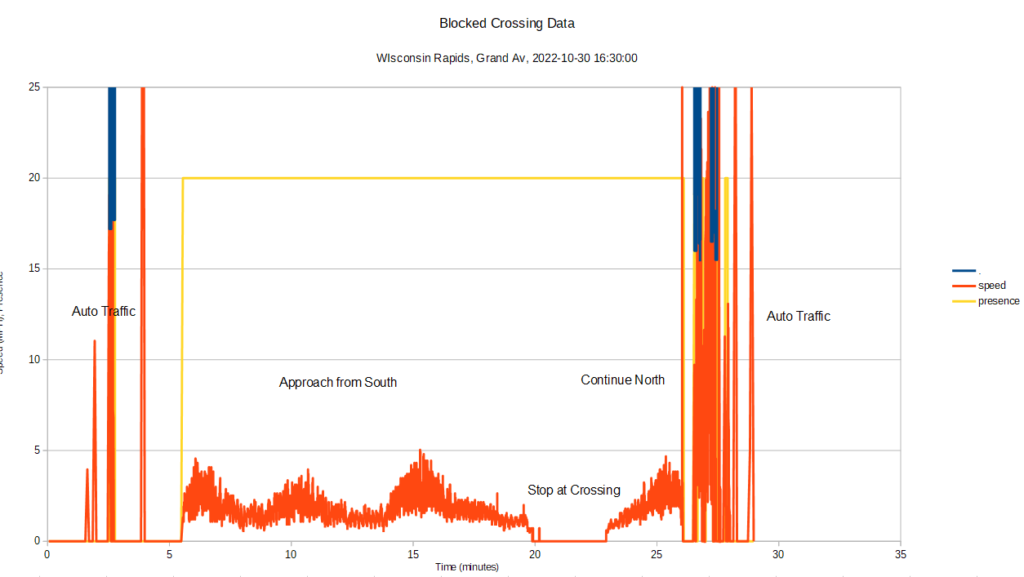
A majority of the time spent with crossings blocked is the result of switching-type operations.
Over 50% of the delay times caused at W Grand Ave. result from a train being stopped on the tracks.
The crossings at Gaynor and Grand are simultaneously blocked less than 10% of the time.
More than 90% of the time, there are existing alternative routes for the areas south of W Grand.
10% of the time, when there is not an alternate route on the south and an alternate route on the north would have to be used (example Bonow Av.), a Grade Separation would be needed to allow access across this north-south section of rail. This echoes Mayor Blaser regarding the concern that multiple crossings are blocked simultaneously and there is no obvious way to determine an alternate path.
The traffic flow at Grand Av is 11900 AADT of the 35000 AADT city wide. A Grade Separation crossing at Grand Av. would likely solve more than 30% of the existing crossing-related traffic flow problems.
There is a fire station on each side of the north south rail for compliance with NIST and NFPA. This is to ensure at least one first responder can access each side of the tracks. However, even with this mitigation, there are 6-12 occurrences each year of fire emergency crews getting blocked at crossings.
There is only one hospital in Wisconsin Rapids and it is on the east side of the north-south rail. Rail blockages with no obvious alternate paths could mean life or death on heart attack, stroke or traumatic injury patients. The cost of care for emergencies doubles approximately every 4 minutes (as noted above, blockages in this city can extend past 20 minutes).
Data was collected using LinqThingz TrainLinq Mobile Sensor Stations. These use the same sensor modules that are part of the LinqThingz real-time Predictive Mobility system. The sensors include LIDAR, RADAR, Magnetometer, Camera, Infrared, Audio, Radio, and a suite of environmental sensors. The data is preprocessed by a proprietary neural network and the data is sent to a server where the data is post processed by another neural network that provides real-time information about current and future blocked crossings and information about the location, speed, direction and length of the trains. A subset of this data is stored for post analysis. The amount and type of data saved can be adjusted for studies like this one.
Rail Crossing Data: Grand Av.
Grand Avenue has the highest road traffic in Wisconsin Rapids with 11900 AADT
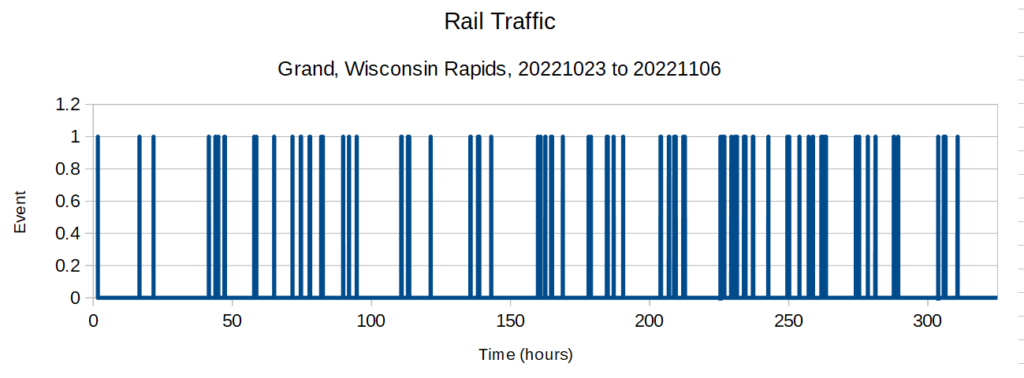
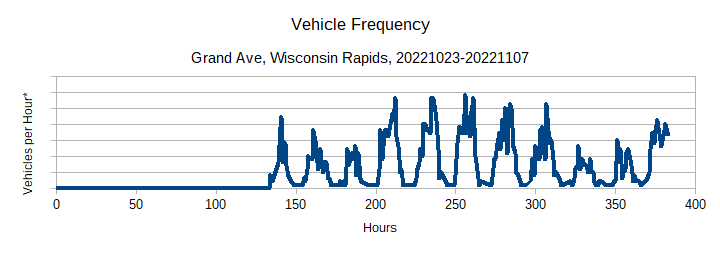
Note that the traffic is zero during the road closure at the beginning of the study.
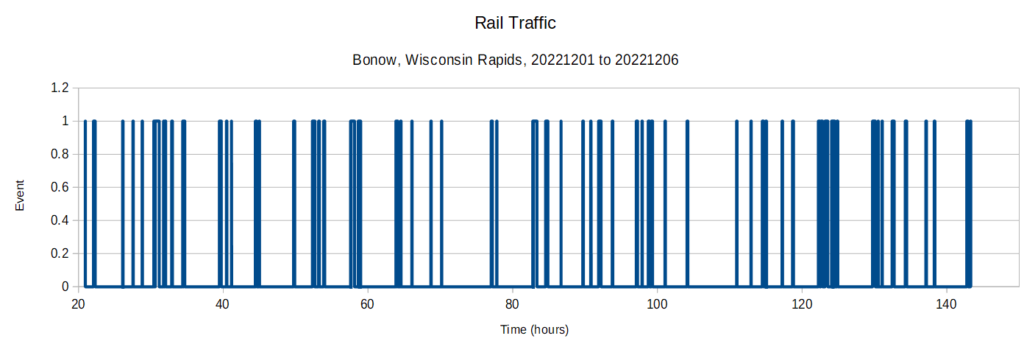
Rail Crossing at Bonow Av. (Hwy F)
The crossing at Bonow seems to have three times the daily traffic compared to Grand Av.
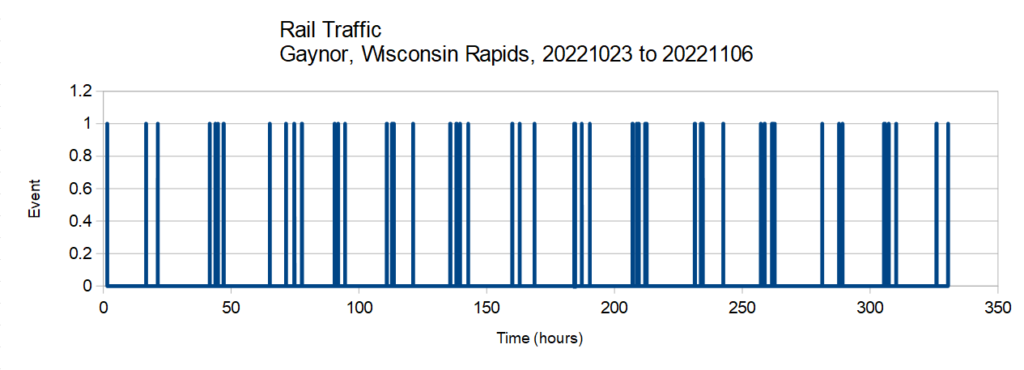
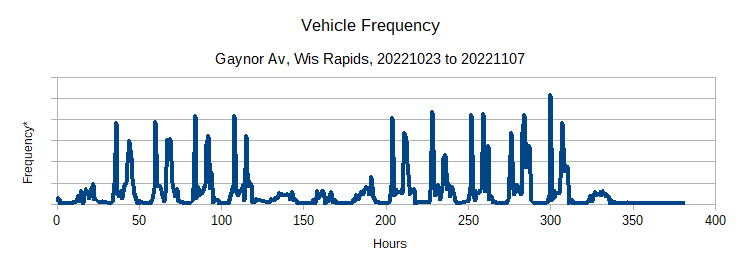
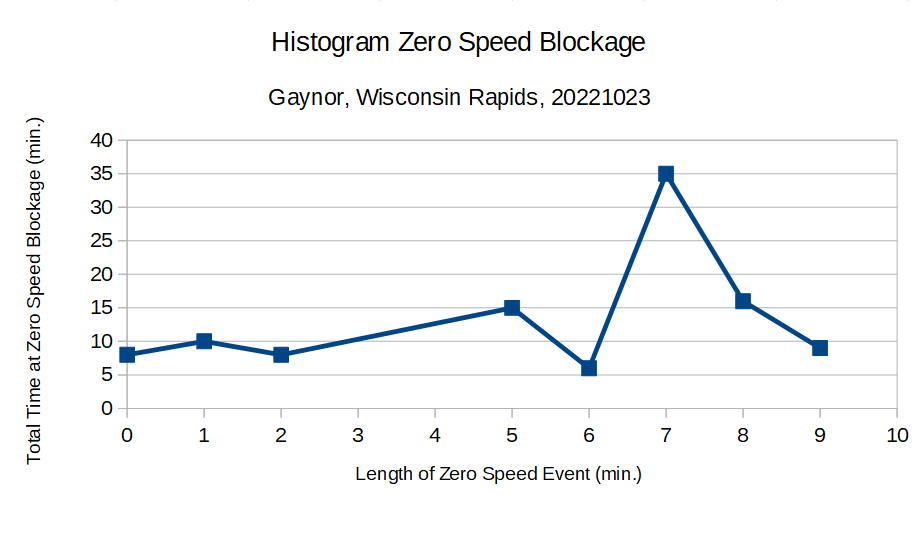
Rail Traffic Gaynor Avenue
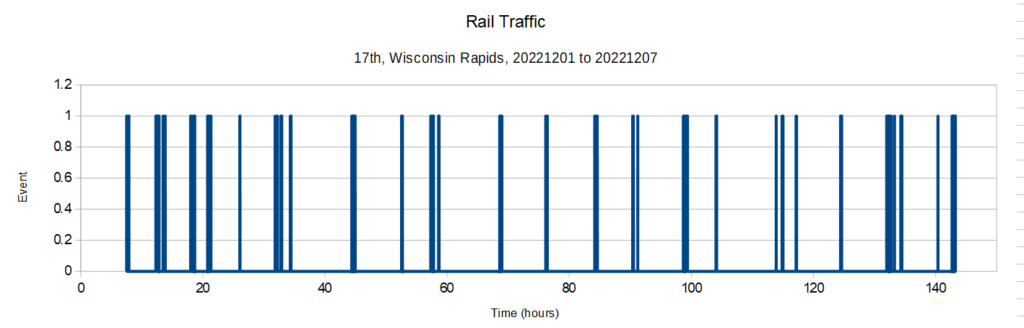
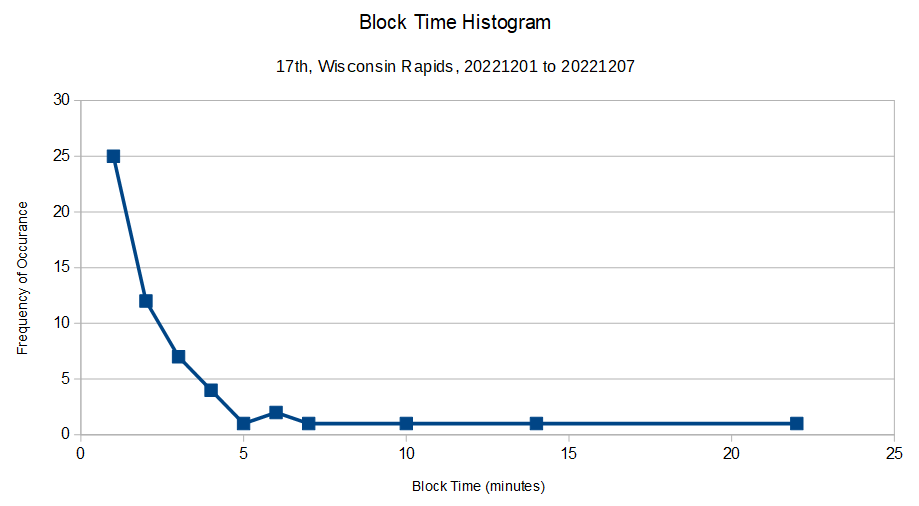
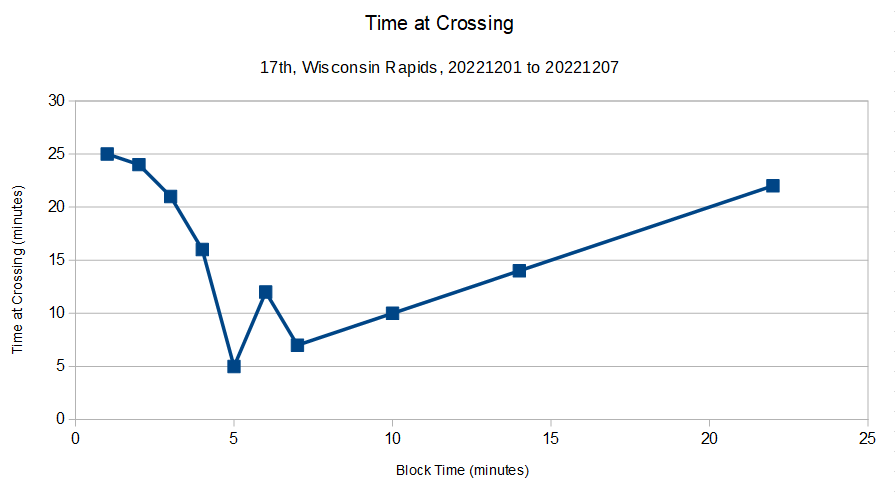
Crossing at 17th (just south of Bonow Av.)
Total Community Congestion Impact
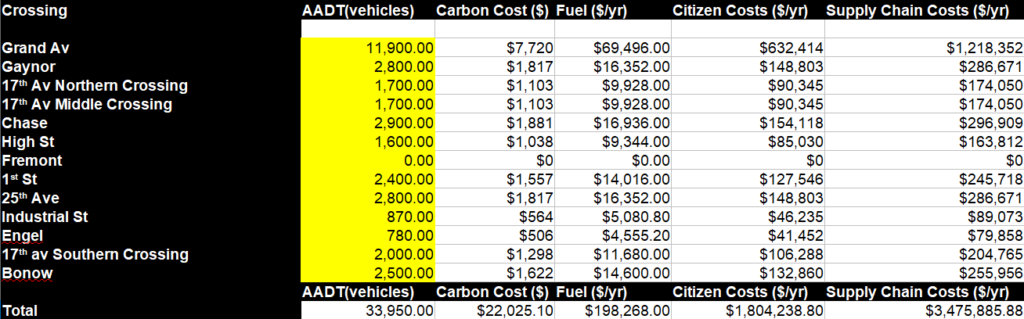
We reviewed data for 13 crossings in Wisconsin Rapids and have provided a preliminary cost impact on the community due to congestion.
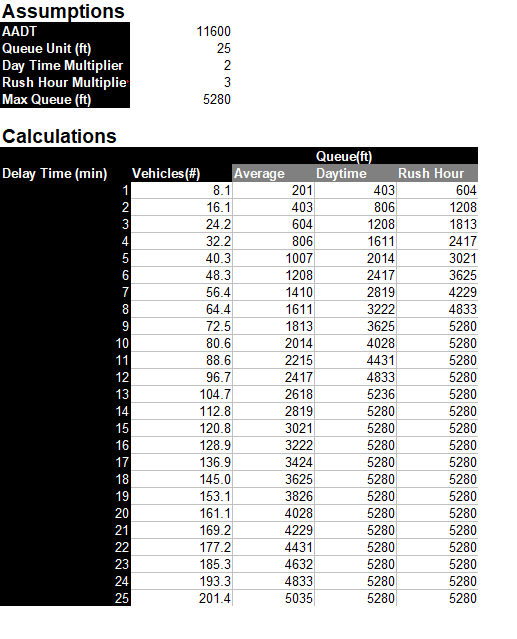
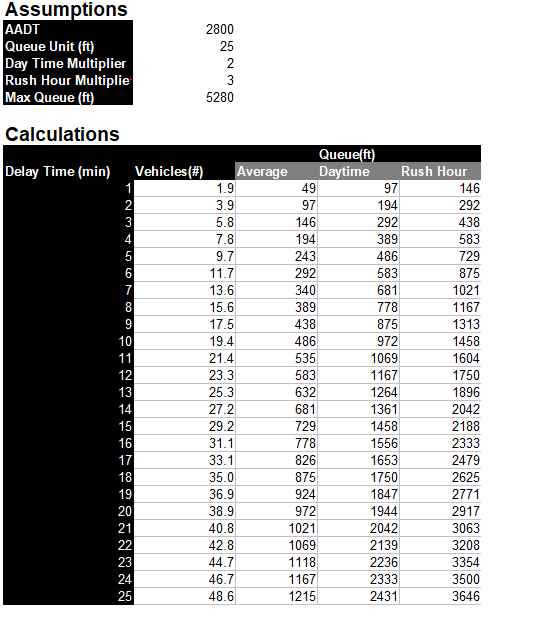
Assumptions
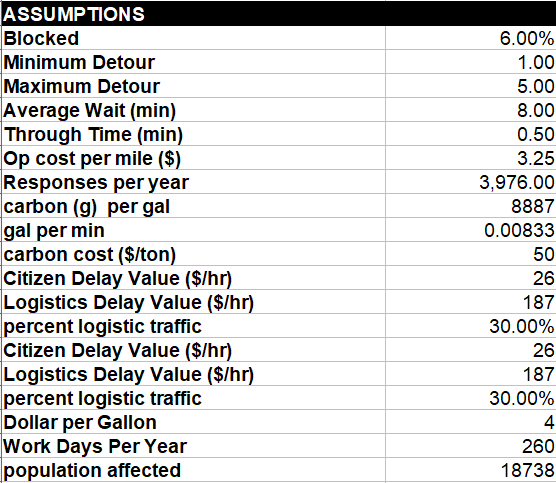
Calculations
Summary
Define Concerns and Issues
Issues: We will use data collected from task 1 along with reports, calculators and guidelines regarding rail congestion and noise published by FRA, FHWA, WISDOT, CN and other standard sources to identify, list and prioritize issues regarding the at grade crossings and rail traffic in the City of Wisconsin Rapids.
Concerns: We will collect information regarding concerns from city leaders, stakeholders, businesses and residents. This will include existing community reports and new community surveys. We will propose three types of surveys 1) Survey for city leaders 2) Survey for companies in the community 3) Survey for residents. We propose the creation of a community online survey that could be promoted through e-mail, social media, public notice and city news letters. The survey will include questions approved by the city. The proposed survey will require identity validation. The survey is based on surveys in other cities with rail congestion and collected from several sources including but not limited to:
- Standard Government Publications
- Demographics of Existing and potentially rerouted areas
- Canadian National Railroad feedback
- Local Chamber of Commerce / Business Groups
- Social Surveys to various city stakeholders
Public Concerns
A public survey was created and made available to the public at: https://forms.gle/VMUkcrCUZjdBacip7
955 residents responded as of December 8, 2022.
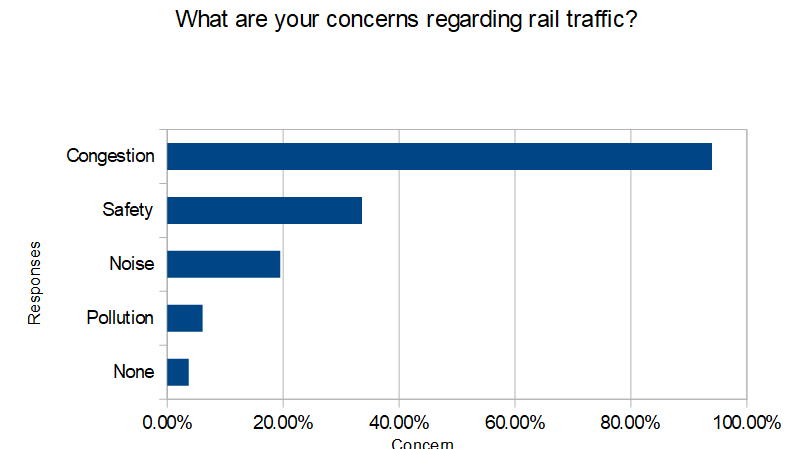
Summary Result: Rail congestion is a concern for 95% of the survey respondents followed by safety, noise and pollution.
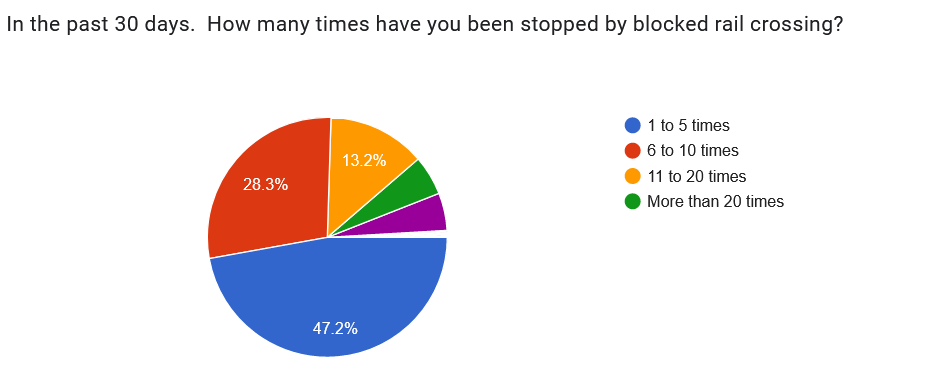
Summary Result: 95% of the community respondents have been blocked by rail traffic in the past 30 days.
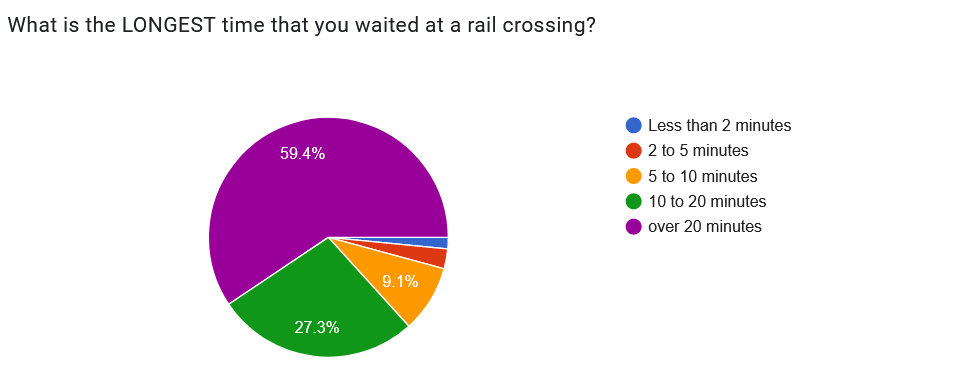
Summary Result: Almost 60% of the community respondents have experienced blockages over 20 minutes in the past 30 days.
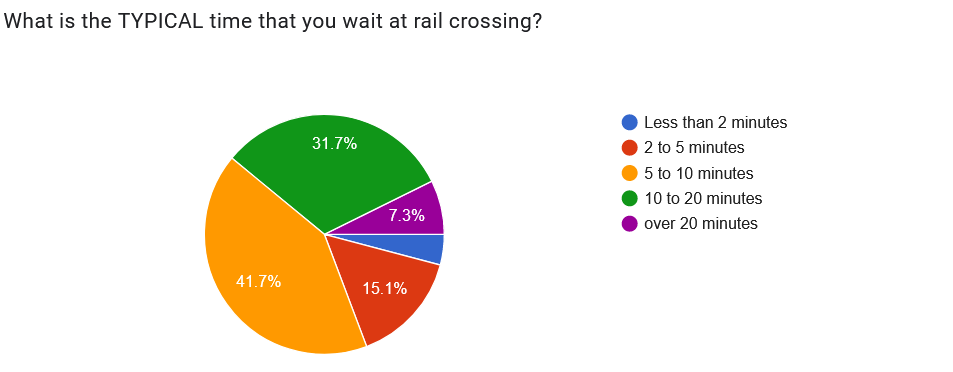
Summary Result: Almost 75% of the community wait time at a crossing is between 5 and 20 minutes.
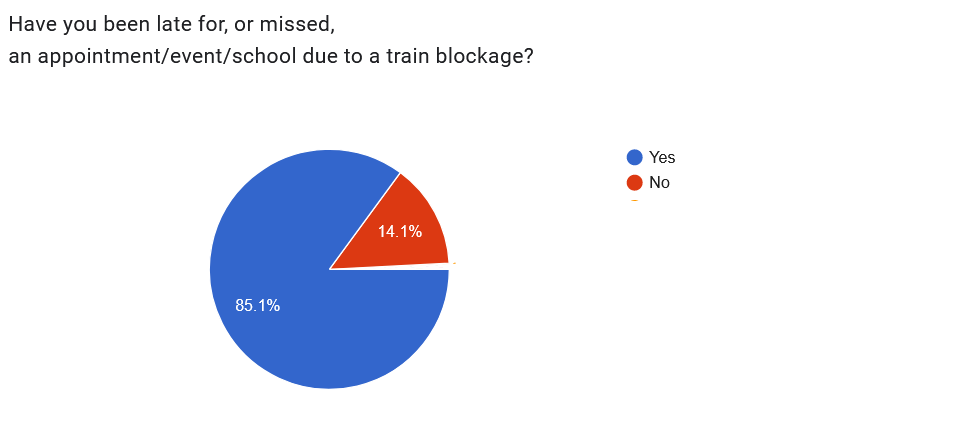
Summary Result: 85% of the community have missed important appointments due to blocked crossings.
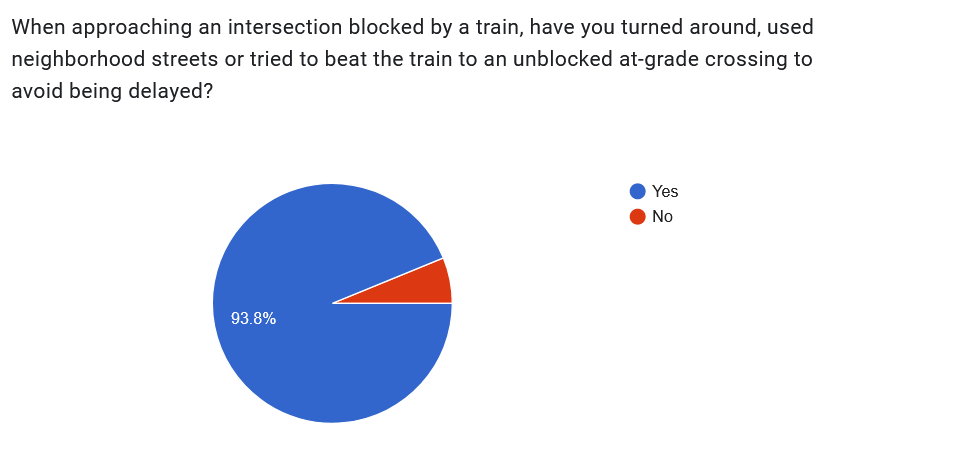
Summary Result: Almost 95% of the community engages in dangerous safety behavior to avoid blocked crossings. Standard safety measures do not address this behavior issue that causes over 70% of grade crossing fatalities according to the FRA.
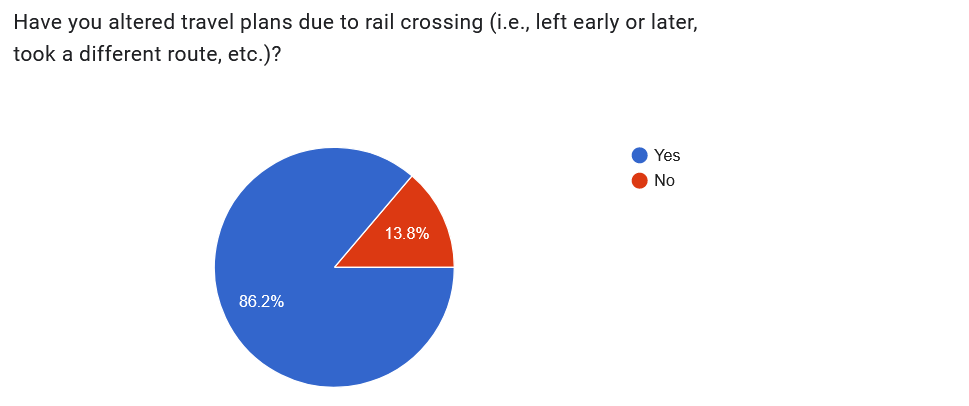
Summary Result: More than 85% change travel plans to address rail crossings. However, no one has information about when they will be delayed or for how long. The crossings are blocked only about 6% of the time. This means, 85% of the time residents alter their plans even though there is a 94% chance that they will not be blocked at a crossing.
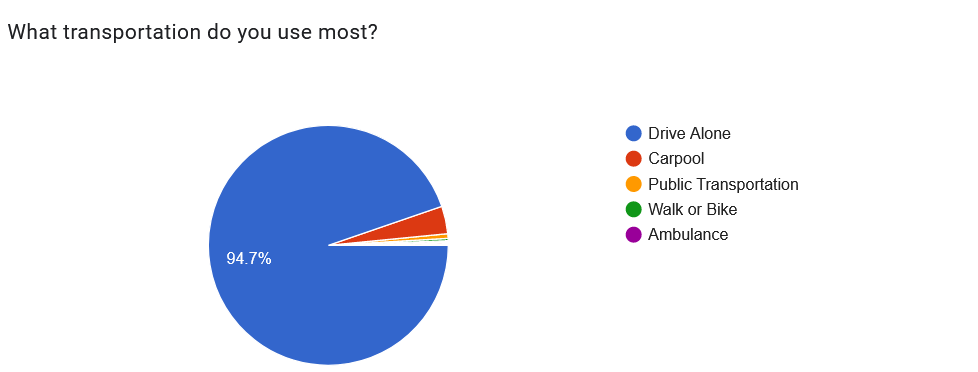
Summary Result: 95% of the impact is people driving their own vehicle.
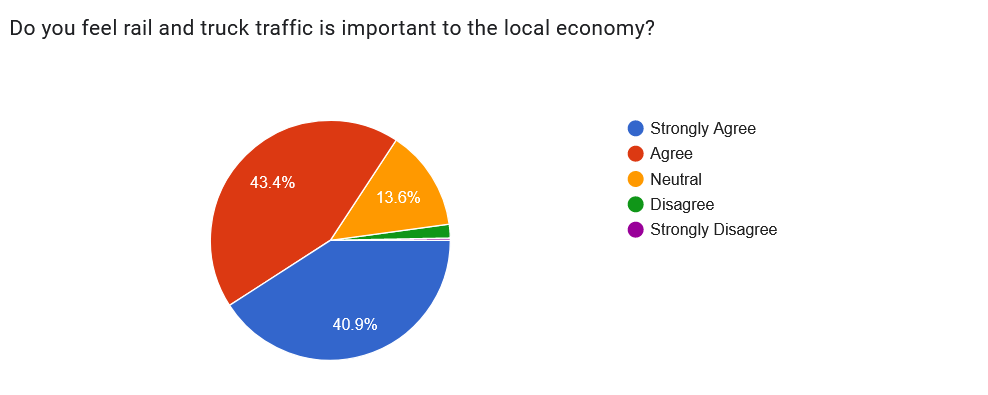
Summary Result: 98% of the community think that rail and truck traffic is important.
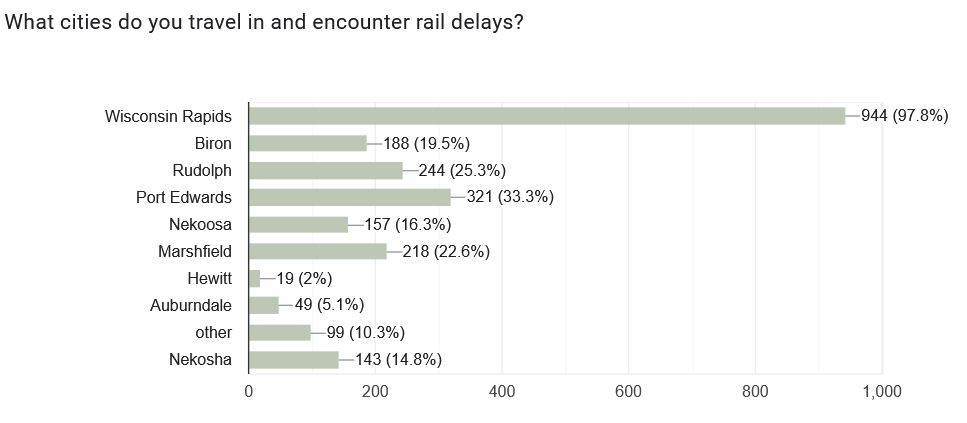
Summary Result: About 18% of the Wisconsin Rapids residents also experience the congestion problems in neighboring communities.
Identify and compare alternatives to address those concerns.
1. Quiet Zone: Quiet zone solutions can help the noise problem but do little to solve current congestion and safety problems. Quiet zones introduce new safety issues. We will analyze and report the benefits, installation requirements and expected results of implementing quite zones. The quiet zone analysis will use available FRA calculators with most recent traffic information.
2. Grade Separation: Grade separation, if fully implemented, can reduce noise, congestion and safety problems and can make incremental improvements for partial implementation. We will analyze the requirements and expected outcomes for partial and full grade separations.
3. Rail Relocation: Rail relocation can reduce noise and congestion for one part of the city while increasing it for other parts of the city. It also requires agreement between many stakeholders including the rail company, the state and federal agencies to be part of the project. We will analyze requirements and expected outcomes.
4. Intelligent Transportation Systems (ITS): GPS phone applications with routing option, etc. New technology solutions that collect information about the location of trains, identify future rail blockages and provide real-time routing guidance through mobile applications, mapping services, computer-aided dispatch, street-mounted variable message signage, and emerging connected vehicle services. Together these can provide safety improvements, reduce congestion and with new legislative changes, could result in alternative Quiet Zone solutions in order to also reduce noise. In addition, this solution creates a dynamic, two way communication with drivers that can be used to measure and improve behaviors. We will analyze the requirements and expected results.
5. Alternate Routing: with physical improvements to aid in diverting traffic around trains.
Alternate routing through road closing, one-way road creation and moving/changing road location can improve congestion, safety and noise. These kinds of changes can benefit some members of the community while causing additional problems for others. Alternate routing, like moving rails, requires agreement between multiple stakeholders. We will analyze requirements and expected outcomes.
6. Rail Company Negotiations: Federal Law requires the railroad to contribute to initial cost and maintain improvements to grade crossings, quiet zones and other grade improvements that remain on rail property. It may be a lower cost alternative for rail companies to consider their current yard practices and find areas for reduced blockage times which also improve rail operations, than to take on longer term expenses involving large construction projects.
ITS – Intelligent Traffic Systems
Intelligent Traffic Systems provide a cost-effective alternative to significant construction projects like rail re-alignment, grade separation and crossing elimination. There are multiple examples of such an approach (e.g. Sugarland Texas). Some solutions tie into traffic signaling and indirectly to rail signaling. In general, this tie-in is against FRA regulations but has been granted an opportunity in specific applications. We will focus on a new technology solution by LinqThingz. This solution is a special category called Predictive Mobility. The implementation involves installing complex sensors (similar to multiple sensor packages in autonomous vehicles) on municipal property (outside of railroad property). The solution does not violate existing FRA regulations. The system collects data at the crossing and determines the speed, direction and length of the train. This information is sent to a collection of US-based cloud servers that then determine which crossing(s) will be open or closed and for how long. The information is communicated to users via multiple possible mechanisms.
- Mobile applications on Android, Windows and Apple iOS.
- Web Applications
- Cloud-based integrations to Computer Aided Dispatch, Transportation Management Systems or a plethora of other connected vehicle platforms.
- Variable Message Signs at the crossing(s) that give drivers advanced warned whether they have advanced application software or not.
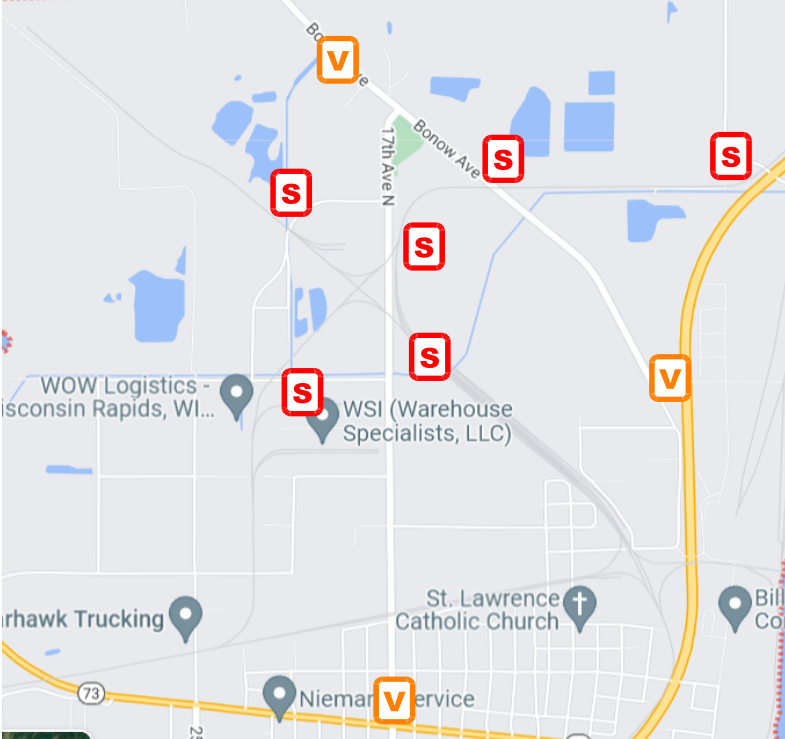
Bonow and 17th
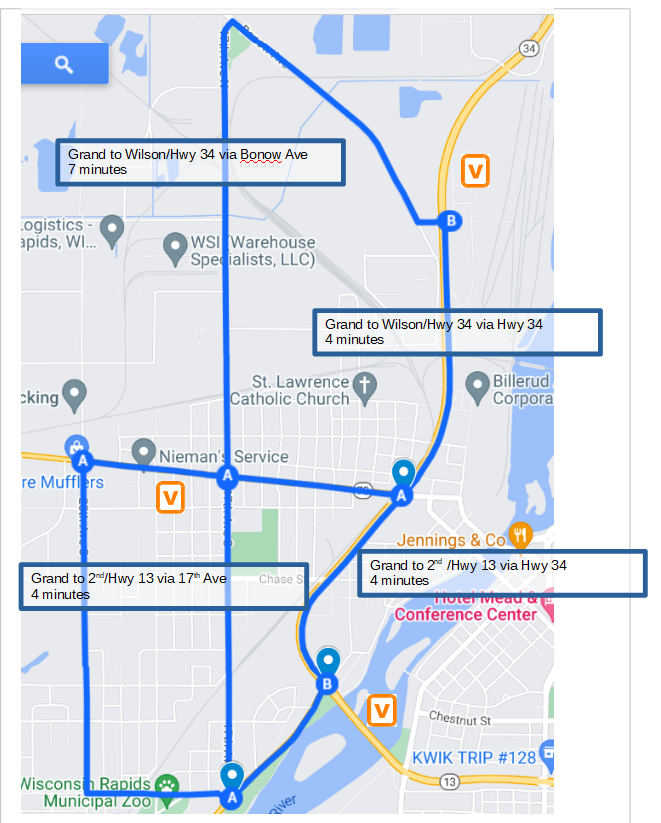
Bonow Avenue Southeast bound traffic, entering the city limits, takes about 1.2 minutes (5000 ft) to reach either the crossing heading straight on Bonow Avenue or turning right on 17th Avenue. The sensor configuration in the illustration below would provide 4 to 6 minutes advance warning about congestion and therefore provides ample re-routing time in this driving use case for a Variable Message Sign [V] located at the city limits on Bonow Ave (County F).
Bonow Avenue Northwest bound traffic, entering from State Highway 13, takes about 1 minute (4000 ft) to reach the crossing on Bonow Av. The sensor configuration in the illustration below would provide 4 to 6 minutes advance warning about congestion and therefore provides ample re-routing time in this driving use case for a Variable Message Sign [V] located at the entrance of Bonow Ave (County F) off State Highway 13.
17th Avenue Northbound traffic, entering from State Highway 73 (Grand Avenue) takes about 2.4 minutes (5280 ft) to reach the crossing at 17th Avenue south of Nash. The sensor configuration in the illustration below would provide 4 to 6 minutes advance warning about congestion and therefore provides ample re-routing time for this next driving use case for a Variable Message Sign [V] located at State Highway 73 (Grand Avenue) .
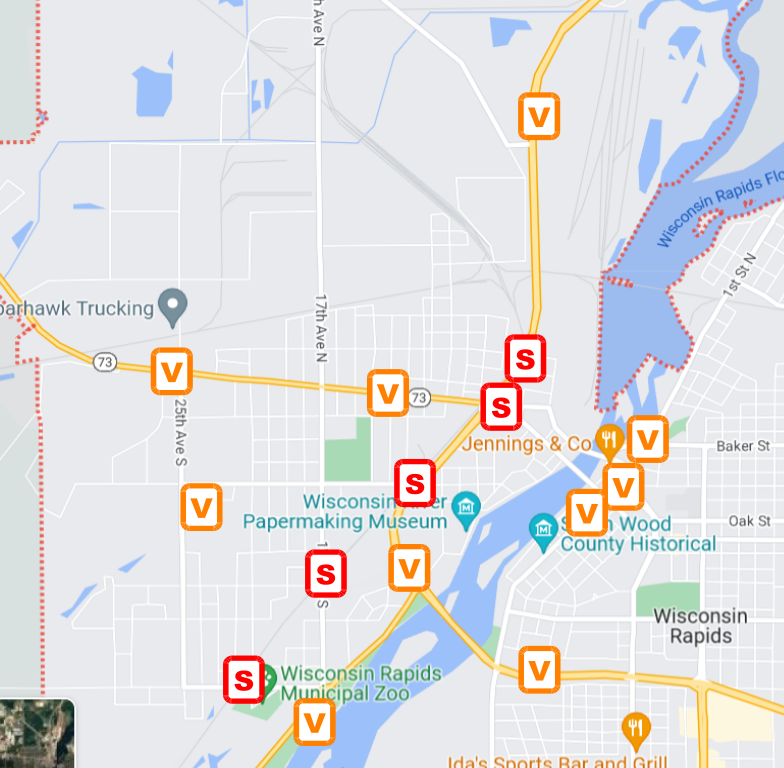
High Street through Gaynor
Grand Avenue Eastbound traffic, entering the city limits, takes about 2 to 4 minutes (8800 ft) to reach either the crossing heading straight or 1 to 2 minutes if approaching from 17th Avenue. The sensor configuration in the illustration below would provide 3 to 4 minutes advance warning about rail traffic approaching from the North and 2 to 8 minutes for rail traffic approaching from the South. The sensor configuration in the illustration below would provide ample re-routing time for a driving use case with a Variable Message Sign [V] located on State Highway 73 (Grand Avenue) .
West bound traffic, entering at W Grand Avenue, Jackson St, Baker St, and1st St takes about 2 to 3 minutes (3600 ft) to reach the crossing at W Grand Avenue. The sensor configuration in the illustration below would provide 3 to 4 minutes advance warning about rail traffic approaching from the North and 2 to 12 minutes for rail traffic approaching from the South. The sensor configuration in the illustration below would provide ample re-routing time with a Variable Message Sign [V] located on Jackson, Baker and 1st Streets.
North/West bound traffic, entering a State Highway 13 (MIA/POW Highway) takes about 2 to 3 minutes to reach the crossing (1.0 to 1.2 miles depending if destination is Gaynor, Chase or W Grand Avenue) . The sensor configuration in the illustration below would provide 3 to 4 minutes advance warning about rail traffic approaching from the North and 2 to 12 minutes for rail traffic approaching from the South. The sensor configuration in the illustration below would provide ample re-routing time in this driving use case for a Variable Message Sign [V] located on State Highway 13 (MIA/POW Highway).
Northbound traffic, approaching on State Highway 73 takes between 2 and 5 minutes, depending on what westbound connection across the rail may be the destination. The sensor configuration in the illustration below would provide 3 to 4 minutes advance warning about rail traffic approaching from the North and 2 to 12 minutes for rail traffic approaching from the South. The sensor configuration in the illustration below would provide ample re-routing time in this driving use case for a Variable Message Sign [V] located on State Highway 73.
Southbound traffic, approaching on State Highway 13, takes less than a minute to get to the crossings starting at High Street, the high volume W Grand Avenue, and a few more minutes, depending on traffic signals, to reach Chase, 17th and Gaynor. The sensor configuration in the illustration below would provide 3 to 4 minutes advance warning about rail traffic approaching from the North and 2 to 12 minutes for rail traffic approaching from the South. The sensor configuration in the illustration below would provide ample re-routing time for these driving use cases with a Variable Message Sign [V] located on State Highway 13/73.
TASK 4: Identify costs, grant funding
The alternatives analyzed in TASK 3 can have vastly different costs and sources for funding. Quiet zone, Grade Separations, and Rail Relocation solutions impact initial and ongoing costs to not only the city, but also the state, federal government and the railroad. They are typically funded through a variety of grants, local funds and railroad budgets. Alternate routing, depending on jurisdiction, impacts initial and ongoing costs to the city, state and federal government but also have small requirements or impact on rail companies. Alternate routing solutions are typically funded through a variety of federal and/or state grants and local municipal budgets. Technology solutions have cost impacts directly to the municipality and require little responsibility from state, federal, and railroad sources. These technology solutions, however, can be funded by a variety of local, state and federal grants. The study will include grant opportunities including but not limited to:
- CMAQ – Congestion Mitigation and Air Quality Improvement Program
- ARPA America Rescue Plan Act
- Bipartisan Infrastructure Investment
- Section 130 Federal Highway Administration’s (FHWA) Highway Safety Improvement Program (HSIP)
- CRISI
- Carbon Reduction-related grants
- Grants related to under served communities for Variable Message Signage
- Wisconsin General Transportation Fund grants
- Alternative/Sustainable funding sources
These grants include traditional transportation grants as per alternative 1,2,3 and 5. The technology solutions also have the opportunity to be funded by communication grants (for the communication infrastructure), and inclusiveness grants (for variable message signage for community members without mobile devices). In addition, this information has the ability to be sold to residents, logistics companies, emergency services, mapping companies, etc. and secure commercial sponsorship. Thus, the technology solution can be sustainable with only minor long-term costs to the community, state, federal and rail stakeholders. We will analyze costs and sources of support and funding for the various solution alternatives.
TASK 5: Implementation of alternatives.
The efforts and hurdles surrounding implementation of alternatives, e.g. the costs, varies greatly. On one end of the spectrum is rerouting rails. Rerouting rails represents significant communication, negotiation and buy-in from multiple sources including the railroad; the state and federal government agencies; potential neighboring communities; and the local acceptance from community members that may/may not benefit from the movement of the rails. On the other end of the spectrum is the ease of implementing technology solutions. Technology solutions really only require the approval of the municipality. Potentially, these solutions could even be placed on private property requiring almost no cost or approvals. The time required to implement the solutions varies widely as well. Rail rerouting could take years to plan and implement. Off the shelf technology solutions could be implemented on the order of weeks for immediate benefit. We will analyze and compare the implementation requirements for the solution alternatives in TASK 3.
TASK 6: Recommendation
We will prepare a final report that summarizes the results from Tasks 1-5, along with a recommendation based on a cost benefit comparison matrix. Benefit metrics will be used and can be compared among all solution alternatives. Cost metrics (including price) will be used and can be compared among all solution alternatives. The cost benefit matrix will be totaled for each alternative and the totals will be compared to provide a recommended solution priority. Two drafts of the report will be provided for changes/feedback and a final report and executive summary will be provided in printed and electronic form.
Decision Matrix
Short-Term Recommendation
TO BE CONTINUED: Installation of a Intelligent Transportation System (ITS) can be accomplished in a mater of months and provides a high visibility solution to residents and businesses. Current mechanisms (cross bucks patented in 1867) to warn about crossings were developed when traffic was horses and roads were dirt. In 2022, we have transitioned from horses to gasoline cars, adopted electric cars, and are moving towards connected and autonomous vehicles as the world is more and more digitally connected. Installation of an ITS like LinqThingz can provide the ability for residents and business to avoid blocked crossings with existing mobile devices. The addition of variable message signage driven by the same flow of data, can provide the capability to all vehicular traffic. The cloud accessible data can integrate into current and emerging transportation management systems, computer aided dispatch systems and emerging connected vehicle infrastructure.
Long-Term Recommendation
TO BE CONTINUED: Developing relationships with rail companies will pay dividends now and in the future. It is possible that rail operations could be modified, to minimize while not eliminating congestion and safety issues. A grade separation at Grand Avenue would be an ideal solution to provide long term relief to rail congestion and safety at that crossing. It could be part of a corridor approach that combines grade separations at certain intersections and ITS solutions at surrounding intersections. However, because of the close proximity to the river and other geographical structures this may be a prohibitively expensive and problematic modification. The primary service in the city seems to be a chemical plant. Perhaps there is a way to use federal funding to relocate the chemical plant to the other side of town; reroute rail switch traffic around current rails to the west side rails, and virtually eliminate switching traffic at the busiest intersections in Wisconsin Rapids. Currently, the through traffic is minimal in both quantity and delay time.
Abbreviations
FRA – Federal Railway Administration